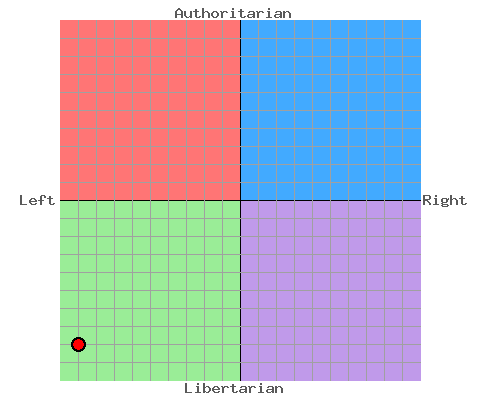
There’s this neat website I found around a decade ago called the Political Compass. It’s basically a short test with a number of rather generic questions about your views on various economic and social issues. It’s short – takes about five minutes – and it gives you an X/Y axis position for your political views. The X axis represents your economic views, from left to right, and the Y axis represents your social views, from the extremes of Authoritarian to Libertarian.
The test forces you to answer all of the questions, and gives you four options: Strongly Disagree, Disagree, Agree and Strongly Agree, which prevents hedging. It forces you to take a stance. The best part is that after it’s done asking you its analysis questions, it gives you your results! That’s right, no entering your email or a ton of demographic questions. It’s just a test to give you a result.
I take this test every year in May. It happens in May because that’s the first time I took it, and just happened to take it again almost exactly a year later. Now, I take it once a year in May, kind of as a benchmark for where I’m at. Spoiler alert: there are only minor fluctuations in my numbers after 2005.
That’s -9.00 Economic, -8.05 Social. Basically, I’m a left libertarian. Waaaay left libertarian.
Now, the fun comes with the analysis of where I measure up compared to the various 2012 Presidential candidates. You might be surprised to see Barack Obama hanging out within one point of his “ideological opposite” Mitt Romney up in right-wing authoritarian land, but if you are, that means you really haven’t been paying attention.
Here are my previous nine results:
May 2012: -9.62 / -7.38
May 2011: -9.12 / -8.21
May 2010: -8.12 / -8.67
May 2009: -7.88 / -7.44
May 2008: -7.50 / -6.97
May 2007: -7.75 / -7.49
May 2006: -8.50 / -7.33
May 2005: -7.25 / -8.51
May 2004t: -8.00 / -5.79
So go take the test! I love seeing where other people place on the spectrum.
